Car Sales Figures And Statistics In Australia
With the number of new car sales in China every year being higher than the number of people in Australia, it is easy to assume that Aussie car market and car sale statistics are unimportant. However, if you take a look at the data per-capita, it tells a different story.
Despite a significant decline in car sales in recent years, Aussies are up there with the biggest car buyers in the world (per person, at least).
Quick Stats
- In 2020, 916,968 new cars were sold in Australia - down by 13.7% in comparison to the year prior, in a fall that is likely attributed to the COVID-19 pandemic.
- 2020 new car sales were the lowest since 2003, and the first time new-car sales dropped below 1 million since 2009.
- 2020's top selling new vehicle in Australia was the Toyota HiLux ute, for the fifth year in a row. This was followed by the Ford Ranger, and then the Toyota RAV4.
- Toyota accounted for over 1/5 of all 2020 Australian new car sales, and were the top selling car brand of the year. This was followed by Mazda (with less than half the sales of Toyota) and then Hyundai at third.
- Electric vehicle sales increased by 69.3% from December 2019 to December 2020, a jump largely attributed to hybrid car sales.
- Car sales surged in the final months of 2020, due to pent up demand, a decrease in restrictions, and earlier orders being filled.
- As of 2020, Australia has 789 vehicles per 1000 people.
How Many Cars are Sold in Australia Each Year?
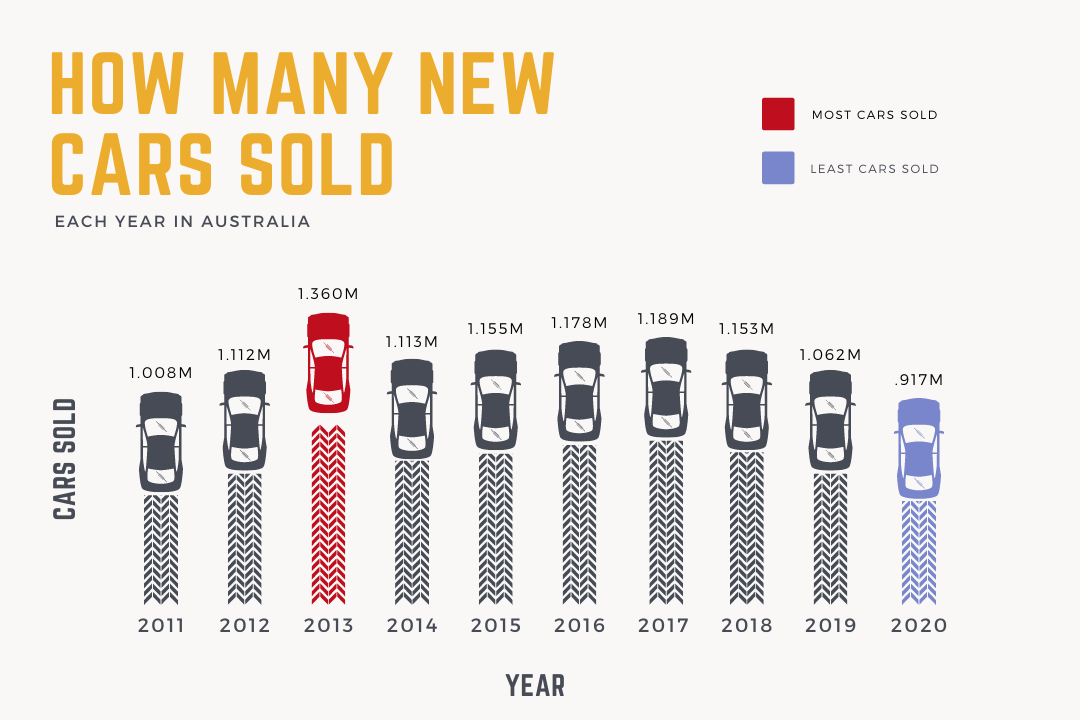
In regard to yearly car sales statistics, new car sales data shows that 11.247 million new car sales were made between 2011 and 2020 in Australia. Over time, these sales were distributed as follows:
- 2011: 1.008m
- 2012: 1.112m
- 2013: 1.36m
- 2014: 1.113m
- 2015: 1.155m
- 2016: 1.178m
- 2017: 1.189m
- 2018: 1.153m
- 2019: 1.062m
- 2020: 0.917m
In 2021, Australian car sales are predicted to see growth and once again reach the 1m mark. So far, this recovery is already underway - in continuing with a trend of high sales in the final months of 2020, January 2021 saw new car sales of 79,666 - the highest January sales since 2012.
New Car Sales Figures In Australia
Looking at the Australian vehicle market and new car sales more generally, the new car market has yet to recover from declining sales - despite positive signs in January 2021, car dealer reports of stock shortages due to rising demand alongside production restrictions are just one example of the difficulties faced within the car market.
Prior to the COVID-19 pandemic, reports on the topic of vehicle buying intentions demonstrated that the number of Australian people planning to buy a new vehicle in the next four years had seen a decrease of 19.1% (attributed to a slowing house market and economy, as well as tightened money lending) . While restrictions and COVID-19 limitations have further impacted these intentions, experts predict that the car industry will see new car sales of over 1 million in 2021, as restrictions are reduced and the economy begins to recover.
Used Car Sales Statistics Australia
While used car data is more difficult to track (thanks to a lack of reporting and the ability to track used car sales), there are plenty of interesting metrics regarding used car information. For example, ABS data collected in early 2018 found that the average age of an Australian car is 10.1 years old - despite such high new car sales, it is evident that used cars are a significant part of the Australian vehicle market.
Furthermore, the Manheim Used Car Report of 2015 found that the Australian second hand car market saw sales data movements of approximately three million units per annum - further evidence of a very lively used car market.
Hybrid & Electric Car Sales Statistics
When it comes to electric and hybrid vehicles, Australian data is once again limited, however it is clear that their popularity is on the rise.
Currently, the number of electric and hybrid vehicles being sold in Australia is fairly low - these figures are difficult to estimate, particularly as Tesla does not publish sales data, which makes the estimation of EV sales difficult. With this being said, Tesla is experiencing an explosion in popularity, and a number of competitors such as Mercedes-Benz and Audi have released their own electric vehicles .
Previous reports have estimated that 2018 saw 1336 EVs (purely electric) sold throughout the country - in 2019, hybrid cars saw sales of 30,641, and December of 2019 saw 6540 electric vehicles (hybrid, pure electric and other) sold.
Ultimately, whilst hybrid sales have previously been driving EV sales, the popularity of pure electric vehicles is increasing.
Top 10 Best Car Brands By Sales in Australia 2021
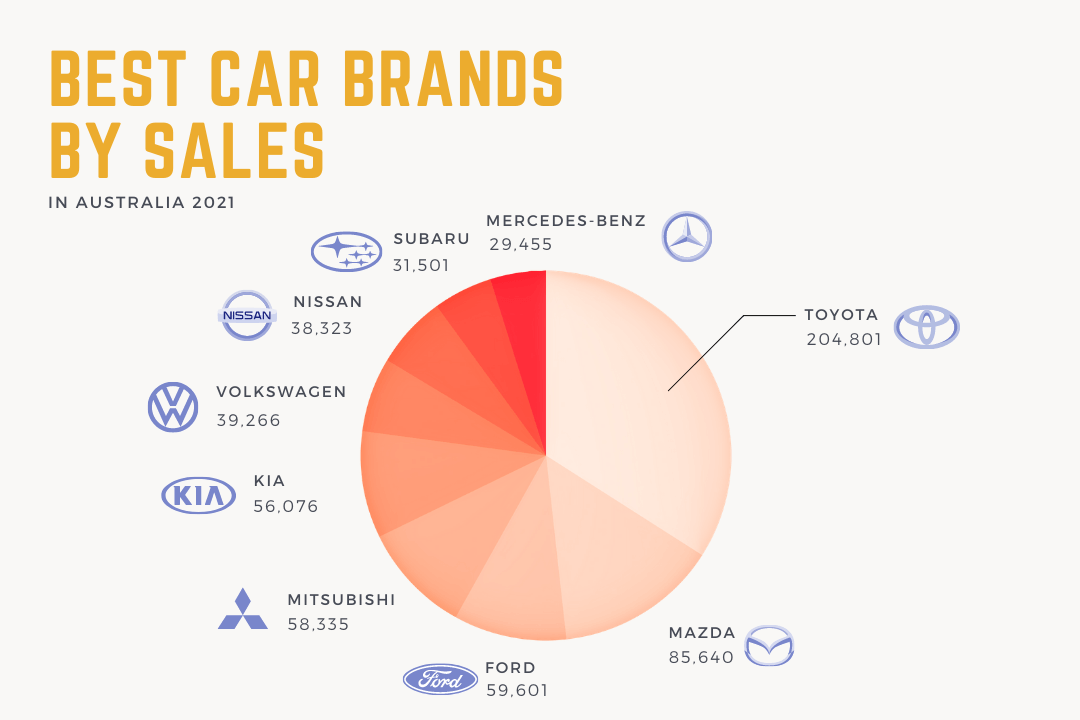
In Australia, the best car brands by sales have been fairly consistent - throughout the past year, the results on unit sales by brand in 2020 were as follows:
- Toyota: 204,801
- Mazda: 85,640
- Hyundai: 64,807
- Ford: 59,601
- Mitsubishi: 58,335
- Kia: 56,076
- Volkswagen: 39,266
- Nissan: 38,323
- Subaru: 31,501
- Mercedes-Benz: 29,455
In comparison to 2019, Subaru and Mercedes-Benz have both entered the leading 10 car brands by sales, taking the places of Honda and Holden. Overall, all of the leading 10 car brands saw decreases in sales, with Toyota seeing a minimal drop of just 965 units.
Top 10 New Car Sales in Australia 2021 by Model
When it comes to car sales by model in the previous year, early 2021 data saw the Toyota HiLux come out on top. Here are the top car sales by model in Australia in 2020.
- Toyota Hilux: 45,176
- Ford Ranger: 40,973
- Toyota RAV4: 38,537
- Toyota Corolla: 25,882
- Mazda CX-5: 21,979
- Hyundai i30: 20,734
- Mitsubishi Triton: 18,136
- Toyota Prado: 18,034
- Kia Cerato: 17,559
- Hyundai Tuscon: 15,789
Types of Passenger Vehicles Sold by Type
Looking at the sales data surrounding passenger car sales by type in Australia, early 2020 data indicates that Australians heavily favour SUVs - four of the top 10 vehicle types, as of the start of 2020, were SUV models. Looking at the overall 2019 data by segment, SUV sales comprised over 50% of total vehicle sales (with the remainder being light commercial and non-SUV passenger cars).
- SUV Medium: 203,223
- Small: 163,701
- SUV Small: 139,250
- SUV Large: 122,333
- Light: 63,055
- Medium: 42,885
- SUV Upper Large: 18,572
- People Movers: 12,543
- Large: 11,531
- Micro: 6,505
Types of Commercial Vehicles Sold by Type
A commercial vehicle can be defined as any vehicle used for paying passengers, transporting goods, or undertaking business activities. As we continue through 2021, a number of trends are becoming clear regarding commercial cars and automobiles.
Looking at December 2019 in particular, data surrounding light commercial automobiles (not including SUVs) indicates that sales made up 23.7% of total automobiles sold in Australia, with 22,675 sales. Taking a closer look, here are light commercial vehicles sold by type (alongside percentage of total car sales for the year):
- Pick-up/cab-chassis 4X4: 16,744 sales (17.5%)
- Vans/cab-chassis: 3084 sales (3.2%)
- Pick-up/cab-chassis 4X2: 2651 sales (2.8%)
- Light buses: 196 seats (0.2%)
Number of Passenger Vehicles Sold by State
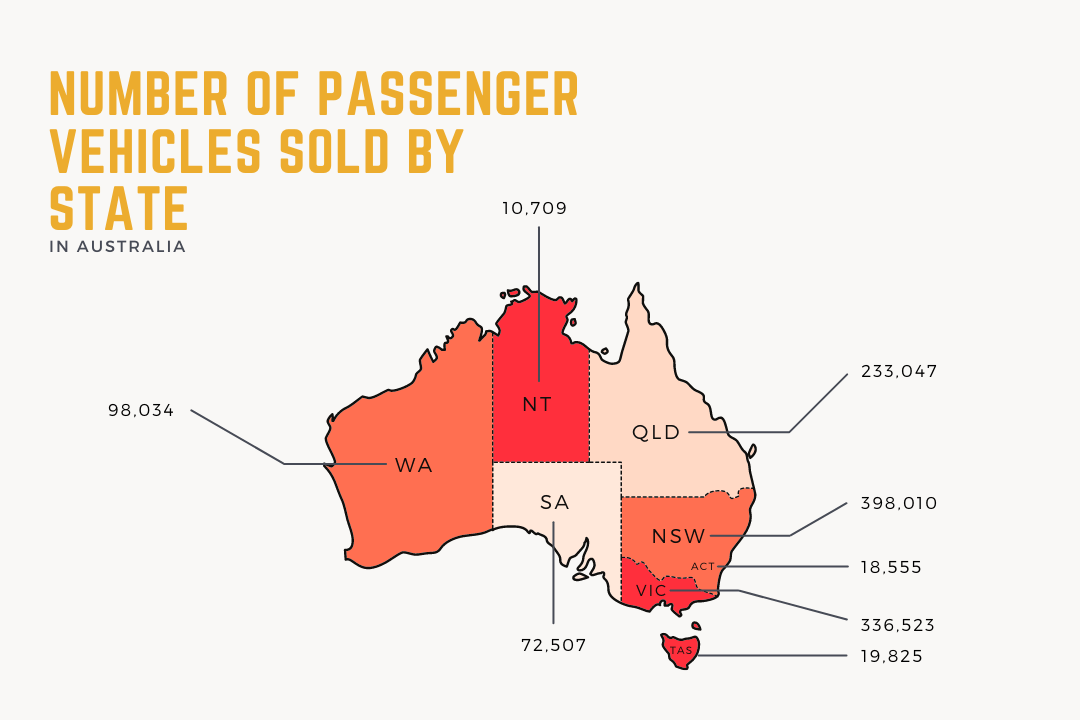
When it comes to passenger car sales by state, New South Wales consistently records the highest sales data. Based on early 2018 ABS data, here is a breakdown of passenger car sales by state in 2017.
- NSW: 398,010
- VIC: 336,523
- QLD: 233,047
- WA: 98,034
- SA: 72,507
- TAS: 19,825
- ACT: 18,555
- NT: 10,709
Within this time period, NSW saw over one third of all car sales in Australia - this is disproportionately high when compared to the NSW population, indicating that NSW owns more cars per person than other state.
Number of Passenger Vehicles Sold by Month
Looking at passenger cars sold by month, car industry data demonstrates significantly lower levels of demand in the earlier months of the year - this seasonality can be attributed to a number of reasons - in particular, a general post Christmas and holiday period slump.
Here are the 2017 figures surrounding vehicle sales on a monthly basis in Australia.
- January: 96,747
- February: 96,915
- March: 97,577
- April: 98,515
- May: 99,390
- June: 99,925
- July: 100,027
- August: 99,791
- September: 99,531
- October: 99,473
- November: 99,565
- December: 99,756
International Comparison
When it comes to Australia's car purchasing tendencies in comparison to the rest of the world, Aussies have some of the highest rates of cars per person. Looking at 2018 data, Australia has population of around 25.18 million people, and 19.2 million registered vehicles. This translates to a per capita metric of 776 vehicles per 1000 people. As of 2020, this number has increased to 789 vehicles per 1000 people.
An interesting comparison to make here is in regard to China - whilst they lead a number of vehicle statistics with 372m motor vehicles as of January 2021 (the highest in the world), they have only 200 motor vehicles per 1000 people.
- San Marino: 1263
- Monaco: 899
- United States: 838
- New Zealand: 837
- Iceland: 824
- Australia: 789
- Liechtenstein: 773
- Malta: 766
- Finland: 752
- Brunei: 721
Australian Electric Car Sales in Comparison to the US
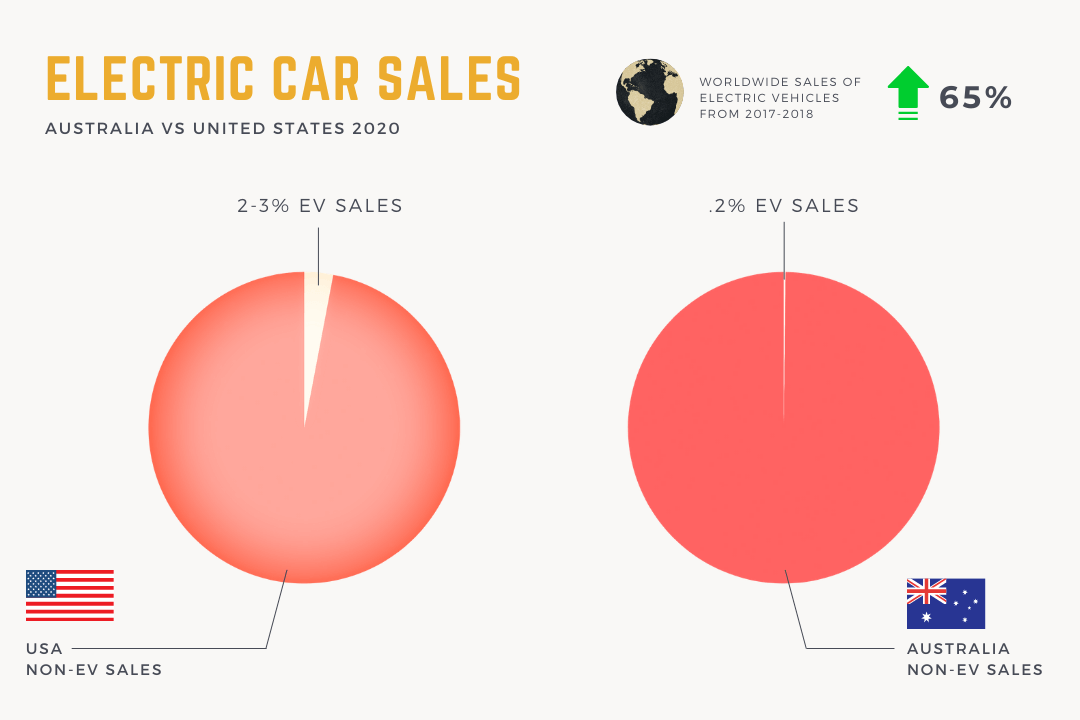
When it comes to sales figures within the EV (Electric Vehicle) industry in Australia in comparison to EV sales within the US, there are a number of notable trends.
- From 2017 - 2018, worldwide sales of electric vehicles increased by approximately 65%.
- In Australia, the first commercial all-electric vehicle wasn’t produced until 2008.
- In 1999, 17 hybrid electric vehicles were sold in the US, with 0 pure electric vehicle sales.
It is estimated that there are 20978 electric vehicles within Australia, as of 2020. 3/10 of these EVs are located in New South Wales - however, electric cars are most common in ACT and SA when considered on a per capita basis. 1 in every 492 cars within the ACT are electric vehicles. Ultimately, electric vehicles comprise just 0.2% of all vehicles within Australia.
In comparison, the US has a significantly more developed electric car industry - in 2020 alone, it is estimated that approximately 328,000 electric vehicles were sold throughout the country. Within these EV sales, the most popular electric car sold in 2019 and 2020 was the Tesla Model 3. Overall, the US electric vehicle market makes up approximately 2-3% of the overall US car market.
Evidently, whilst the US electric vehicle market is more developed in comparison to the AU market, it is clear that plug-in vehicles continue to be overshadowed by traditional cars from a sales point of view.
Frequently Asked Questions About Car Sales Statistics
Which brand sold the most cars in 2019?
In 2019, Toyota was the most popular car brand amongst Australians, with 205,766 new cars sold.
What is the #1 selling car?
In Australia, the number one selling car is the Toyota HiLux, which saw sales figures of 45176 in 2020. Worldwide, the most popular car is the Toyota Corolla, which is also Australia's top passenger car.
How Many Cars Sold Australia 2019?
In Australia, there were 1.06 million new cars sold throughout 2019.
How Many Cars Have Been Sold in 2019 Worldwide?
In 2019, 74.9 million new cars were sold across the world.